Drawing a simple pattern with p5js
I have recently started to pick up on my coding skills. I’ve discovered Processing a few years back while in a digital fabrication class in architecture school. I was very exited by the clarity and awesomeness of the code. I’ve done a lot of work in the past with ActionScript 2.0 and 3.0. But, in recent years my interest diverted a bit. This is an attempt to revive this skill. P5js is a JavaScript framework written with the same goals as Processing, to make coding accessible for artists, designers, educators, and beginners.
My first attempt was to replicate a pattern with code. Can I create a program that would allow me to see different color variations?
First, I started looking at how this might translate into code with a sketch.

//create a variable to decide which vertex to fill

var fillIt = true;

var dontfillIt = false;
function setup() {

createCanvas(920, 700);

}
function draw() {

background(255);

var dimension = 100; //size of the motiff unit

//loop thorugh every row and column and place the pattern

for (var i = 0; i < 800; i = i + 200) {

for (var j = 0; j < 800; j = j + 200) {

pattern(0, i, dimension);

pattern(200, i, dimension);

pattern(400, i, dimension);

pattern(600, i, dimension);

pattern(0 + 100, j + 100, dimension);

pattern(0 + 300, j + 100, dimension);

pattern(0 + 500, j + 100, dimension);

}

}

}
//draw the motiff unit

function draw_vertex(dimension, x1_coord, y1_coord, x2_coord, y2_coord, x3_coord, y3_coord, fillIt) {

// Set the points of the triangle

var x1 = dimension * x1_coord;

var y1 = dimension * y1_coord;

var x2 = dimension * x2_coord;

var y2 = dimension * y2_coord;

var x3 = dimension * x3_coord;

var y3 = dimension * y3_coord;

//check if the polyline needs filling

if (fillIt === true) {

fill(1, 148, 68);

} else {

noFill();

}

beginShape();

vertex(x1, y1);

vertex(x2, y2);

vertex(x3, y3);

endShape();

}
//Draw the pattern

function pattern(x, y, dimension) {

push();

translate(x, y);

// Look familiar? this is from the sketch vertex abstraction

draw_vertex(dimension, 0, 1, 0, 0, 1, 0, fillIt);

draw_vertex(dimension, 0.5, 1, 1, 1, 1, 0.5, fillIt);

draw_vertex(dimension, 0, 0.5, 0.5, 0.5, 1, 1, dontfillIt);

pop();

}
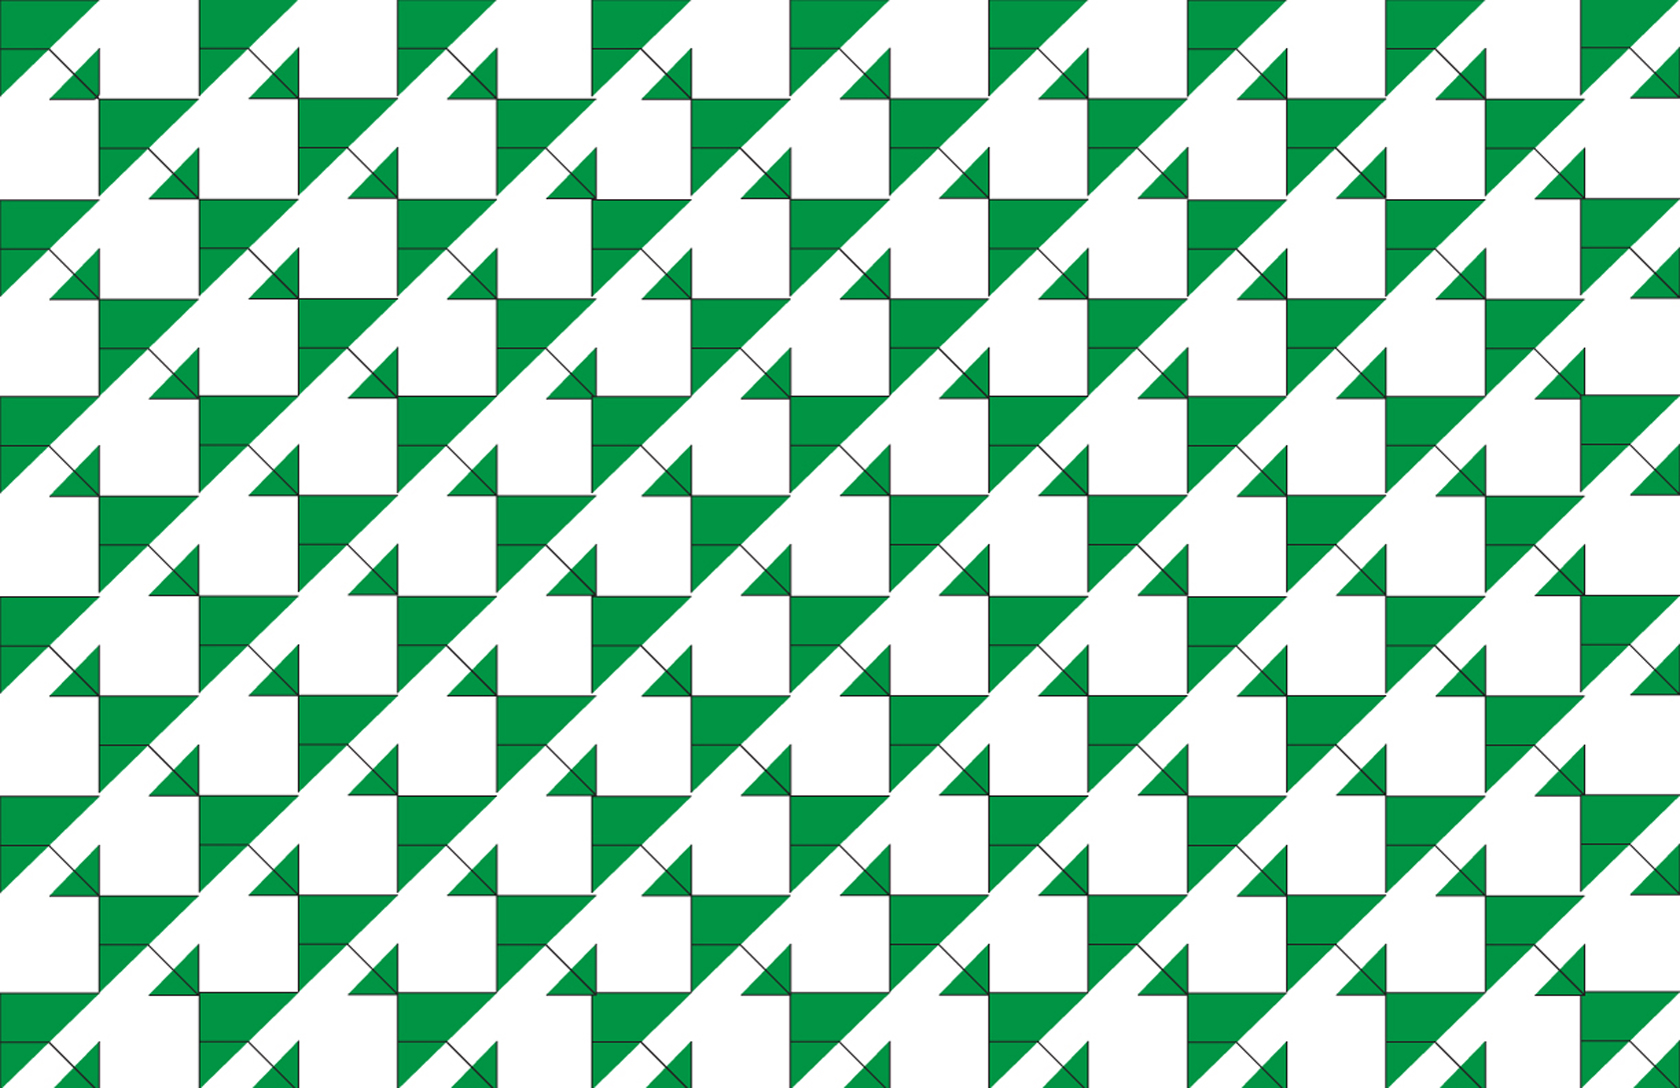
I struggle for a while with the logic. But finally I was able to draw some results

So, let’s make this a bit more fun. Why no change the color on every other row in relationship to the row above, and add some sliders to let the user have control over the colors. See final code below
//create some variables to store the sliders

var rSlider, gSlider, bSlider, aSlider;

var fillIt = true;

var dontfillIt = false;
function setup() {

createCanvas(800, 700);

// initialize sliders

rSlider = createSlider(0, 255, 200);//range and starting value of slider

rSlider.position(20, height - rSlider.height + 20);//position sliders
gSlider = createSlider(0, 255, 200);

gSlider.position(gSlider.width + 30, height - gSlider.height + 20);
bSlider = createSlider(0, 255, 180);

bSlider.position(bSlider.width + 180, height - bSlider.height + 20);

}
function draw() {

var dimension = 100;

for (var i = 0; i < 800; i = i + 200) {

for (var j = 0; j < 800; j = j + 200) {

pattern(0, i, dimension);

pattern(200, i, dimension);

pattern(400, i, dimension);

pattern(600, i, dimension);
pattern2(0 + 100, j + 100, dimension);

pattern2(0 + 300, j + 100, dimension);

pattern2(0 + 500, j + 100, dimension);
}
}
}
function draw_vertex(dimension, x1_coord, y1_coord, x2_coord, y2_coord, x3_coord, y3_coord, fillIt, clr) {

// Set the points of the triangle

var x1 = dimension * x1_coord;

var y1 = dimension * y1_coord;

var x2 = dimension * x2_coord;

var y2 = dimension * y2_coord;

var x3 = dimension * x3_coord;

var y3 = dimension * y3_coord;

// //color variations

if (fillIt === true) {

fill(clr);

} else {

noFill();

}

beginShape();

vertex(x1, y1);

vertex(x2, y2);

vertex(x3, y3);

endShape();

}
//Draw the pattern

function pattern(x, y, dimension) {

//store the value of the sliders into a variable

var r = rSlider.value();

var g = gSlider.value();

var b = bSlider.value();

//now you control the color values from the slider component

var clr1 = color(r-50, g-50, b-50);

var clr2 = color(b-100, r-100, g-100);

push();

translate(x, y);

draw_vertex(dimension, 0, 1, 0, 0, 1, 0, fillIt, clr2);

draw_vertex(dimension, 0.5, 1, 1, 1, 1, 0.5, fillIt, clr1);

draw_vertex(dimension, 0, 0.5, 0.5, 0.5, 1, 1, dontfillIt, clr1);

pop();

}
//Draw the pattern with a variation for every other row

function pattern2(x, y, dimension) {

var r = rSlider.value();

var g = gSlider.value();

var b = bSlider.value();

var clr1 = color(r, g, b);

var clr2 = color(b, r, g);

push();

translate(x, y);

draw_vertex(dimension, 0, 1, 0, 0, 1, 0, fillIt, clr2);

draw_vertex(dimension, 0.5, 1, 1, 1, 1, 0.5, fillIt, clr1);

draw_vertex(dimension, 0, 0.5, 0.5, 0.5, 1, 1, dontfillIt, clr1);

pop();

}
The results are seen below: